
How to Use
Using Environment Canada’s radar data can be quite beneficial in weather sensitive decisions. To assist users, a comprehensive table of contents is listed below.
Table of Contents
Using the Radar Images
The RADAR images can be broken down into 4 main sections.
- Image display system
- Animation – Playback Controls
- RADAR images
- Overlays
- Intensity Scale
1. Image display system
The system in place allows one to display by default the PRECIP-ET product which depends on both conventional and Doppler data. Occasionally Doppler data are not available for some radars, in which case the system displays CAPPI products that rely solely on the conventional data. On the other hand, if one or more radars are not available or under maintenance, the system displays a contingency product based on a composite generated from the available neighbouring radars.
In some cases, this composite, which is based on the product PRECIP-ET may include US radars. It is also important to note that for some regions neighbouring radars may not cover the entire domain of the radar out of service. To this end and to help the user identify these non-covered areas, red circles have been added to show the contributing radars in this composite.
The figure below illustrates an example of a composite built from 4 radars (two Canadian and two American) and generated over the XNI (Superior West) radar domain. For this example, we see that these four radars do not cover the whole domain of the XNI radar and circles warn the user of the presence of a non-covered area outside of the circles. It is important to note that these circles will be activated on the image only if the contributing radars to the composite are available.

2. Animation – Playback Controls
How you can use the playback controls. The following is an explanation of the common playback controls for the different views of the radar images.
The first picture loaded in your browser at any level of view is the latest image available. Any playback button which can produce an action will be in blue and clickable, while the buttons which cannot produce an action will be in grey and disabled. The functionality of the buttons is determined by the position of the viewed image and the total number of images in the series.

The displayed image will be, by default, the latest one available in a series of 7 or 10 images (11 or 16 images for the new modern radar; read more on the new modern radar). The time interval between images is either 10 or 20 minutes (6 or 12 minutes for the new modern radar). To animate the series of images, you first need to click the "Play" button in the playback controls above. The animation of the images will stop after 5 minutes of uninterrupted play. Re-selecting the play button will re-activate the animation. In addition, you can select the images individually.
The Playback Controls are as follows:
- Play: Used to "play" or activate the series of images in the loop.
- Stop: Used to "stop" the series of images in the loop.
- First Image: Used to loop back to the first image in the series.
- Previous: Used to move backward one image at a time.
- Next: Used to move forward one image at a time.
- Last Image: Used to loop ahead to the last image in the series.
- Decrease the speed of the animation in the loop of images.
- Increase the speed of the animation in the loop of images.
- Reset the speed of the animation to its original setting.
The Short Animation (1 hr) will be a series of 7 frames at 10 minute intervals (11 frames at 6 minutes intervals for the new modern radar) and the Long Animation (3 hrs) will be a series of 10 frames at 20 minute intervals (16 frames at 12 minutes intervals for the new modern radar).
Default selection for Animation is Short (1hr).
3. Radar Images
Description of the three level views
3.1. National View

3.2. Regional View

3.3. Local View

4. Overlays
All Overlays will appear upon selection and can be combined with other overlay layers.
By default, the cities layer is displayed at national, regional and local levels.
By default, the local level radars will also display circles, and roads.
5. Intensity Scale
The radar layer can be displayed in either eight or fourteen colour levels on the national, regional and local views.
By default the fourteen level colour palette is displayed.
Short term forecast
How to Estimate Motion of Precipitation in Radar Images?
By comparing a series of RADAR images, forecasters can observe the development of a disturbance, follow its trajectory, determine the intensity of precipitation, issue alerts or warnings, and fine-tune their forecasts. You too can apply a few techniques to make a short term forecast.
How to animate our RADAR images to make a short term forecast (1 to 3 hours)?
- Select a RADAR site.
- Click on the "Play" button to activate the controls.
- Observe the movement of the precipitation echoes on the screen.
Note: The local view radar image is oriented such that true North is located at the top of image.
Now, you need to determine the speed at which the echo is moving. This will allow you to forecast where it’s likely to be in 1 or 2 hours. For this, you need to choose 2 images with a one hour interval.
Suggested method:
- Back the pictures one hour from the time of the latest image and note where the precipitation echo is located.
- Now go back to the latest image and measure the distance between the 2 echo positions.
- Compare this to the distance between 2 of the concentric circles on the image.
- Knowing that the distance between 2 circles is 40 kilometres you can estimate the speed at which the precipitation is moving and in what direction.
- Knowing that "North" is located at the top of the image, echoes moving to the right, for example can be properly interpreted as moving eastward.
Example:
Let’s say that precipitation echoes are moving from the west towards the radar and you want to know when the precipitation will reach the radar site (the centre point).
- You have noted that the echoes on the image from an hour ago touch the 4th concentric circle (160 km from the RADAR).
- The most recent image shows that the echoes have reached the 3rd concentric circle (120 km from the RADAR).
- This means that the precipitation is moving at 40 km/h towards the RADAR.
- If the speed of the precipitation doesn’t change, you can expect that it will reach the RADAR in 3 hours.
You can also identify whether the intensity of precipitation is getting stronger or weaker by watching the color variations of the corresponding echoes. Similarly, you can identify the trend of precipitation (weakening or developing) by noting the expansion or contraction of the total coverage area in time.
Conclusion
You can now make your own short term forecast based on the movement of the RADAR echoes for any point on the RADAR screen.
All you need to do is:
- measure the distance between the echoes with a ruler,
- compare this with the concentric circles distance, and
- determine the speed at which precipitation is approaching.
What we are doing
Weather Forecasts
Weather Alerts
Weather Resources
Features
Need to travel Alberta Highway 93?
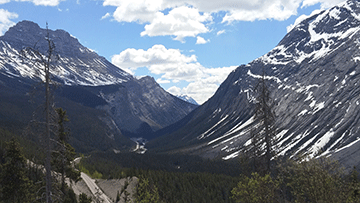
Go prepared with Highway 93 forecasts. Highway regions are available in the Alberta text forecast bulletin between Lake Louise and Jasper. (Photo by: Natalie Anderson)
- Date modified: